Journal of Political Risk, Vol. 1, No. 7, November 2013.
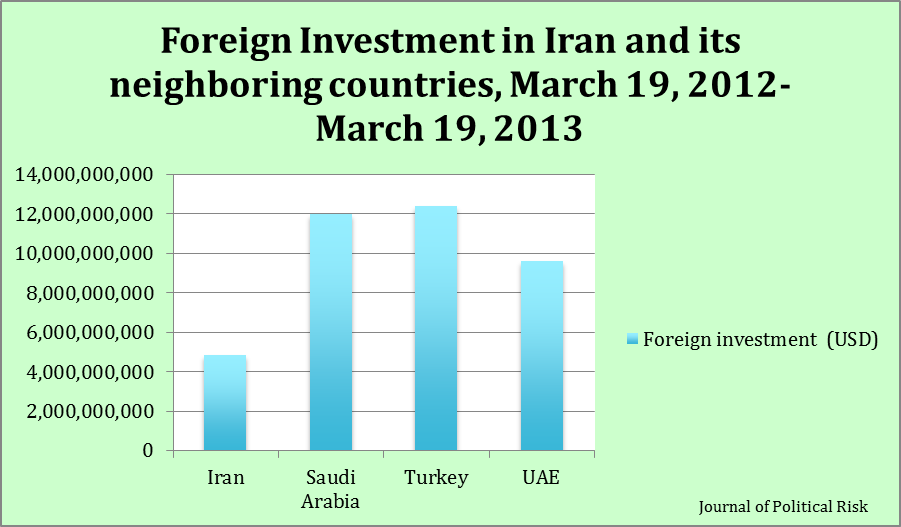
Figure 1: Foreign Investment in Iran and its Neighboring Countries, March 19, 2012-March 19, 2013. Data Source: The Government of the Islamic Republic of Iran News.
By Reza Yeganehshakib
Despite a tumultuous recent political history that includes revolution, war and sanctions, relations between Iran and the West are improving and Western investors are increasingly interested. But, Iran’s politics cause sanctions, and the economy suffers from inflation. Protectionist laws are on the books, and in some cases economic crimes are punishable by death. Regardless of warming relations with the West, Iran has in the past reneged on its agreements, and war is still a risk with non-Western bordering countries and regional powers. The Iranian Revolutionary Guard Corps (IRGC) has nationalized foreign investments in the recent past, and the politically powerful revolutionary foundations known as Bonyads control large segments of the most lucrative investment sectors.