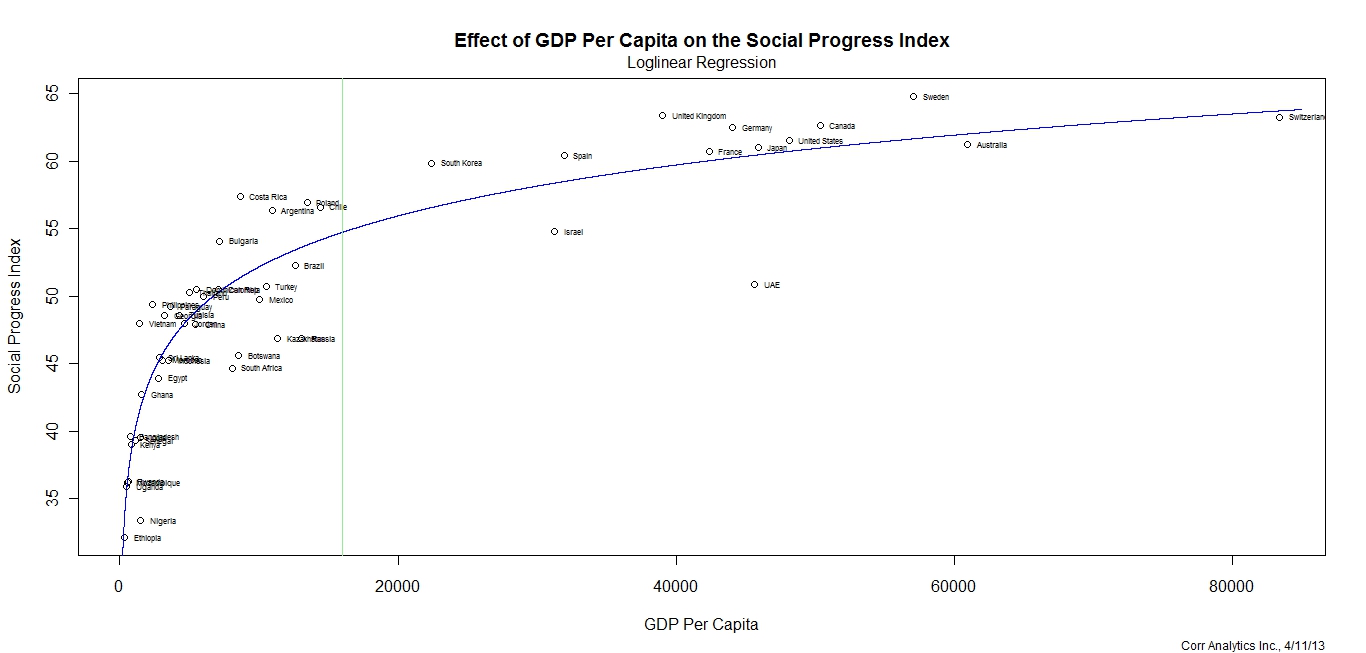
Figure 1. Effect of GDP Per Capita on the Social Progress Index (Model 1)
Journal of Political Risk, Vol. 1, No. 1, April 2013.
By Anders Corr, Ph.D.
Social Progress Imperative, a global group that produces well-being data for 50 countries, released their Social Progress Index (SPI) today. The index compares countries not on GDP, but rather on a single quality of life metric as a function of housing, health, education, and environmental sustainability. The index is backed by Harvard Business School professors and the Skoll Foundation (WSJ).
Sweden, Britain, and Switzerland have the best Social Progress Index scores, because these countries have some of the highest GDPs per capita of the fifty countries in the index. It is no coincidence that the three lowest SPI scores – Ethiopia, Nigeria, and Uganda, have very low GDPs per capita. The best way to understand SPI is therefore to control for GDP per capita. Corr Analytics did simple regression analysis on SPI. Approximately 84% of the index is explained by gross domestic product (GDP) per capita (see technical details below). Countries with large economies relative to their populations will have more wealth that can be channeled to the basic necessities measured by SPI. Therefore the simpler standard used by economists for decades — GDP per capita — works quite acceptably for well-being.
Interestingly for development economists, when comparing the index to GDP per capita using loglinear regression, it shows that for countries below the mean GDP per capita ($16,030 in the sample), the positive effect of GDP per capita growth on social progress is very high. The effect after mean GDP per capita is still positive, but of a much lesser magnitude. Development funding, therefore, yields the highest social progress gains in the most impoverished countries.
Adding the degree of democracy to the regression model brings the explained variance to 87%. Democratic nations are better able to leverage GDP for basic necessities, probably because of effective voting coalitions of the economically disadvantaged.
The theoretical range of the Social Progress Index is zero to 100, with 100 indicating the greatest possible provision of well-being. The actual range of the data is 32 (Ethiopia) to 65 (Switzerland). Given the 33-point actual range of the Social Progress Index, the effect of changes in GDP per capita and democracy are substantial. An increase in $10,000 GDP per capita for the poorest country in the dataset yields an increase of 17.5 points on the Social Progress Index. That same $10,000 increase for the richest country yields only a 0.6 increase on the Social Progress Index. A change from pure dictatorship (autocracy) to full democracy yields an expected 7.5-point increase on the Social Progress Index.
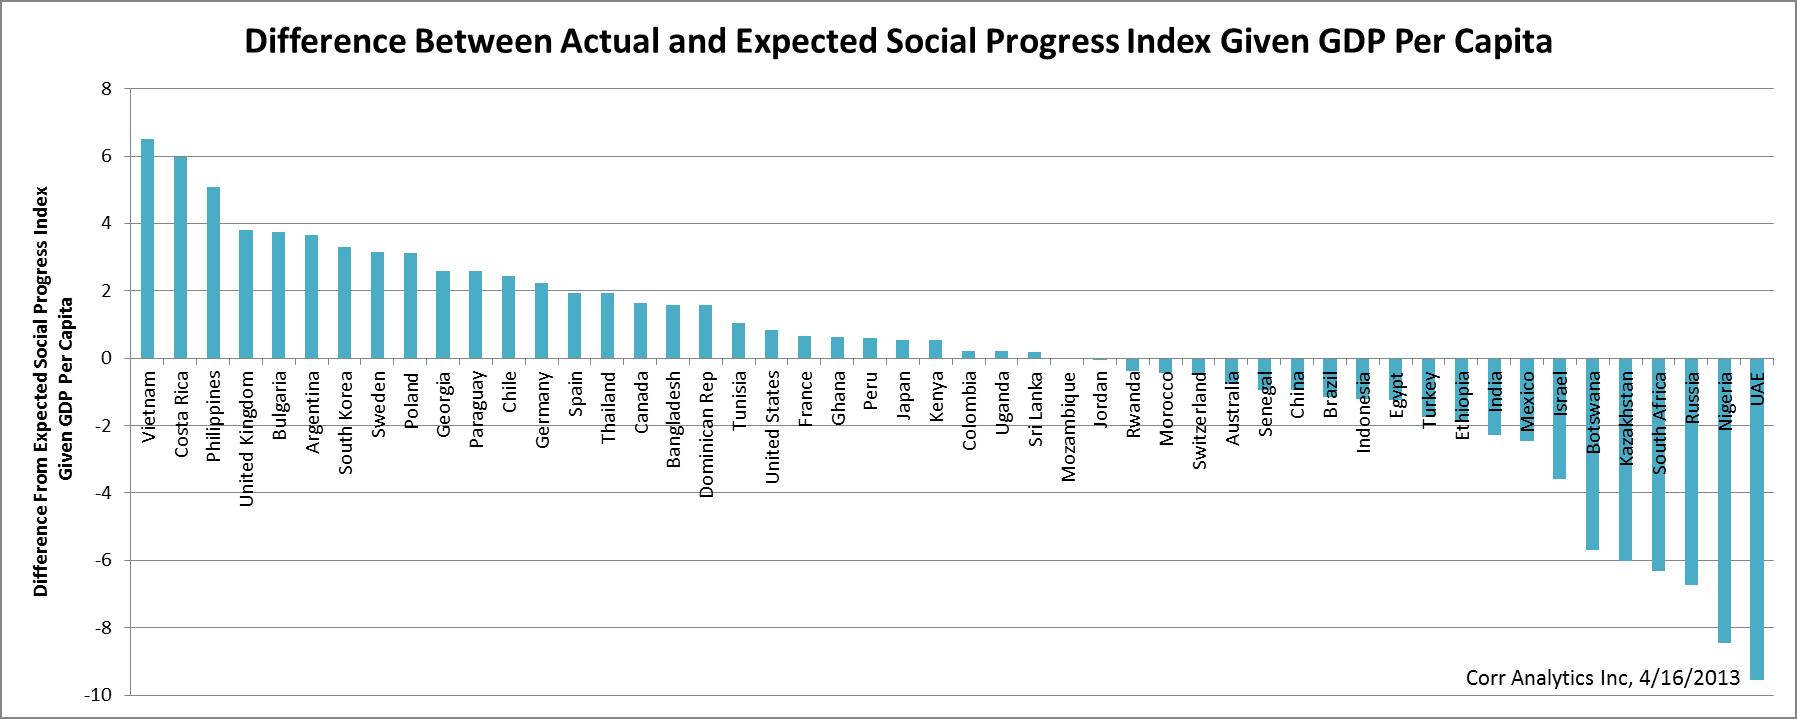
Figure 2. Difference Between Actual and Expected Social Progress Index Given GDP Per Capita (Model 1)
As shown in Figure 2, the regression also elucidates countries that are social performers and laggards given GDP per capita. Vietnam, Costa Rica, the Philippines, Britain, Bulgaria, and Argentina are the six highest performers given GDP per capita. With the exception of Vietnam, these countries are democratic. The UAE, Nigeria, Russia, South Africa, Kazakhstan, and Botswana are the six lowest performers on the Social Progress Index given GDP per capita. Most of the laggards are dictatorial or have pseudo-democratic forms of government.
Technical details
Corr Analytics obtained the Social Progress Index data (2013) from the Social Progress Imperative organization, GDP per capita data (2011) from the World Bank, and democracy data (2011) from professors at Colorado State University and the University of Maryland. The democracy data is known in academia as the “Polity II” measure.
Using the R-statistical programming language, we ran a series of linear regression models in which we regressed the Social Progress Index on the natural log of GDP per capita and the level of democracy (10 being very democratic and -10 being very autocratic). The regressions used 50 observations for Model 1, and 49 observations for all other models due to missingness in one observation. The relatively small number of observations is due to the year 2013 being the first year of the Social Progress Index, with no additional years of data available.
The models jointly show a significant effect (at the 99% significance level or above) of natural logged GDP per capita on the Social Progress Index. The models also show, with a significance level at or above 99%, a positive effect for the degree of democracy measure.
Model 4, which adds an interaction between logged GDP per capita and degree of democracy, has the largest adjusted r-square value (.8748). The coefficient on the interaction term indicates that as the degree of democracy increases, the effect of GDP per capita on the Social Progress Index increases. Democratic nations are better able to leverage GDP for basic necessities, probably because of effective voting coalitions of the economically disadvantaged.
Using predictions from Model 4 and holding democracy at its mean of 5.7, an increase in $10,000 GDP per capita for the poorest country in the dataset yields an increase of over 17.5 points on the Social Progress Index. That same $10,000 increase for the richest country yields only 0.6 points on the Social Progress Index.
Model 4 also shows a positive and significant (at the 99% confidence level) effect from democracy when controlling for logged GDP per capita. When a country changes from pure autocracy to the highest democracy score (a positive change from -10 to 10 on the Polity II score), we should expect an increase of approximately 7.5 on the Social Progress Index. In democracies, poor voters have an advantage in pressing for improvements in basic health, housing, and education, as compared to such poor communities in autocracies. They use this advantage to improve access to the basic necessities measured by the Social Progress Index.
The Model 4 regression is of the form, s= a + b log(gdppc) + c democracy + d democracy log(gdppc + e, where s is the Social Progress Index, a is the intercept, b is a coefficient on the logged value of GDP per capita, c is the coefficient on the Polity 2 democracy scale, d is the coefficient on the interaction term, and e is an error term. Coefficients, standard errors, adjusted r-squares, and number of observations for each model are provided in the table below.
[table],Model 1,Model 2,Model 3,Model 4
Intercept,1.9606 (3.0165),.3.52720 (2.99840),45.5669*** (1.6168), 11.05770*** (3.82949)
Log(GDP PC),5.4513*** (0.3378), 5.12476*** (0.35554),,4.20991*** (0.45936)
Democracy,,0.22620* (0.09668),0.7808*** (0.2061),-1.28542* (0.53469)
Democracy*Log(GDP PC),,,,0.17143** (0.05978)
Adj. R-Square,.8412,.8551,.2177,.8748
Observations (n),50,49,49,49
[/table]
Significance levels: 0 ‘***’ 0.001 ‘**’ 0.01 ‘*’ 0.05 ‘.’ 0.1
Standard errors are in brackets.
JPR Status: Working Paper