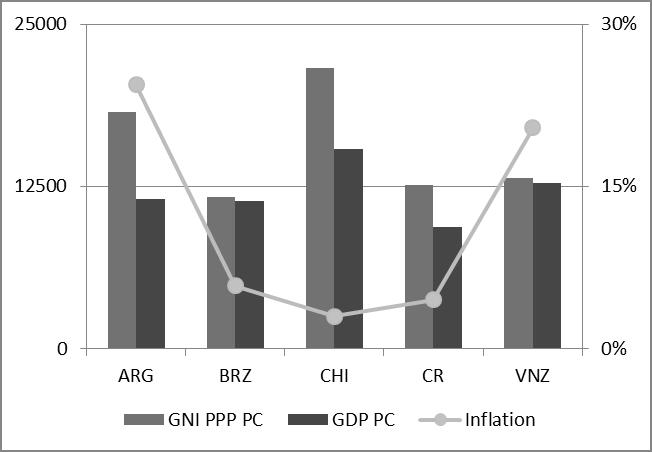
Figure 1: Economic data for Argentina, Brazil, Chile, Costa Rica and Venezuela. Sources: Worldbank 2012, Index Mundi and Agencia Brasil.
Journal of Political Risk, vol. 1, no. 3, July 2013.
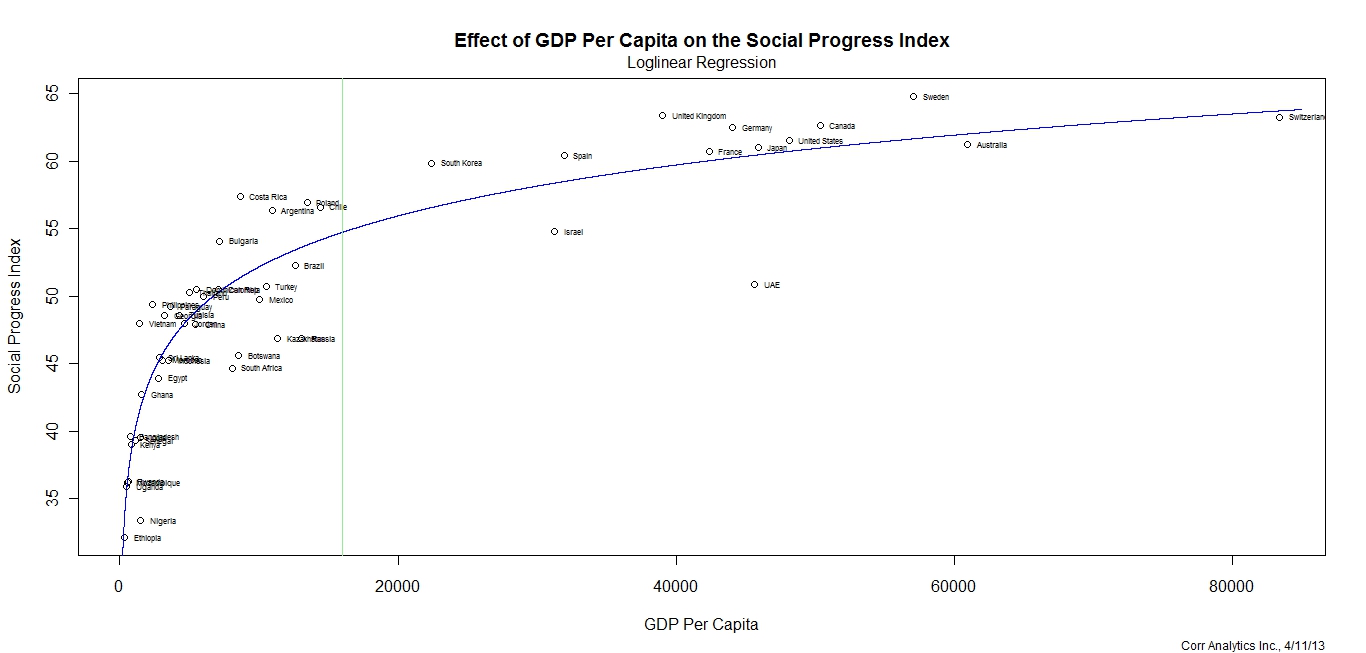
Over the last twelve months, it would seem that the habitants of Latin America and the Caribbean are particularly adept at protesting against their leaders and institutions, especially in Brazil, Chile and Costa Rica. Over a one-year period, Brazilian, Chilean and Costa Rican government officers witnessed hundreds of thousands of citizens protesting issues such as crime, corruption, and the lack of low-cost quality public services.
Although there are many differences among the movements, the similarities are striking. First, protesters target problems that have significant impact in their lives: education, transportation and political inefficiency. Second and counter-intuitively, those countries have all enjoyed economic booms recently. Finally, all three countries face important elections in the near-term future. Continue reading